Understanding Clustering Analysis
Pranav Karra
Clustering Overview
- Unsupervised learning
- Requires data, but no labels
- Detect patterns e.g. in
- Group emails or search results
- Customer shopping patterns
- Regions of images
- Useful when don’t know what you’re looking for
- But: can get gibberish
Workshop Overview
This presentation will teach you the basics of clustering, including:
- Understanding the concept of clustering
- Learning about the K-means algorithm
- Implementing K-means in practical scenarios
- Exploring image segmentation using K-means
Basic Concept
- Basic idea: group together similar instances
- Example: 2D point patterns


Similarity Measures
- What could similar mean?
- One option: small Euclidean distance (squared)
- Clustering results are crucially dependent on the measure of similarity (or distance) between “points” to be clustered
\[dist(\vec{x}, \vec{y}) = ||\vec{x} - \vec{y}||^2_2\]
Clustering Algorithms
Two main categories:
- Hierarchical algorithms
- Bottom-up: agglomerative
- Top-down: divisive
- Partitional algorithms (flat)
- K-means
- Mixture of Gaussians
- Spectral Clustering
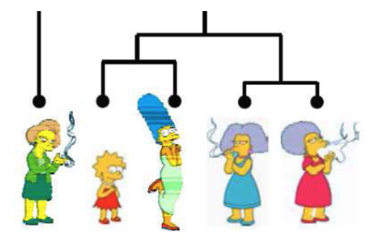

Hierarchical Clustering Example
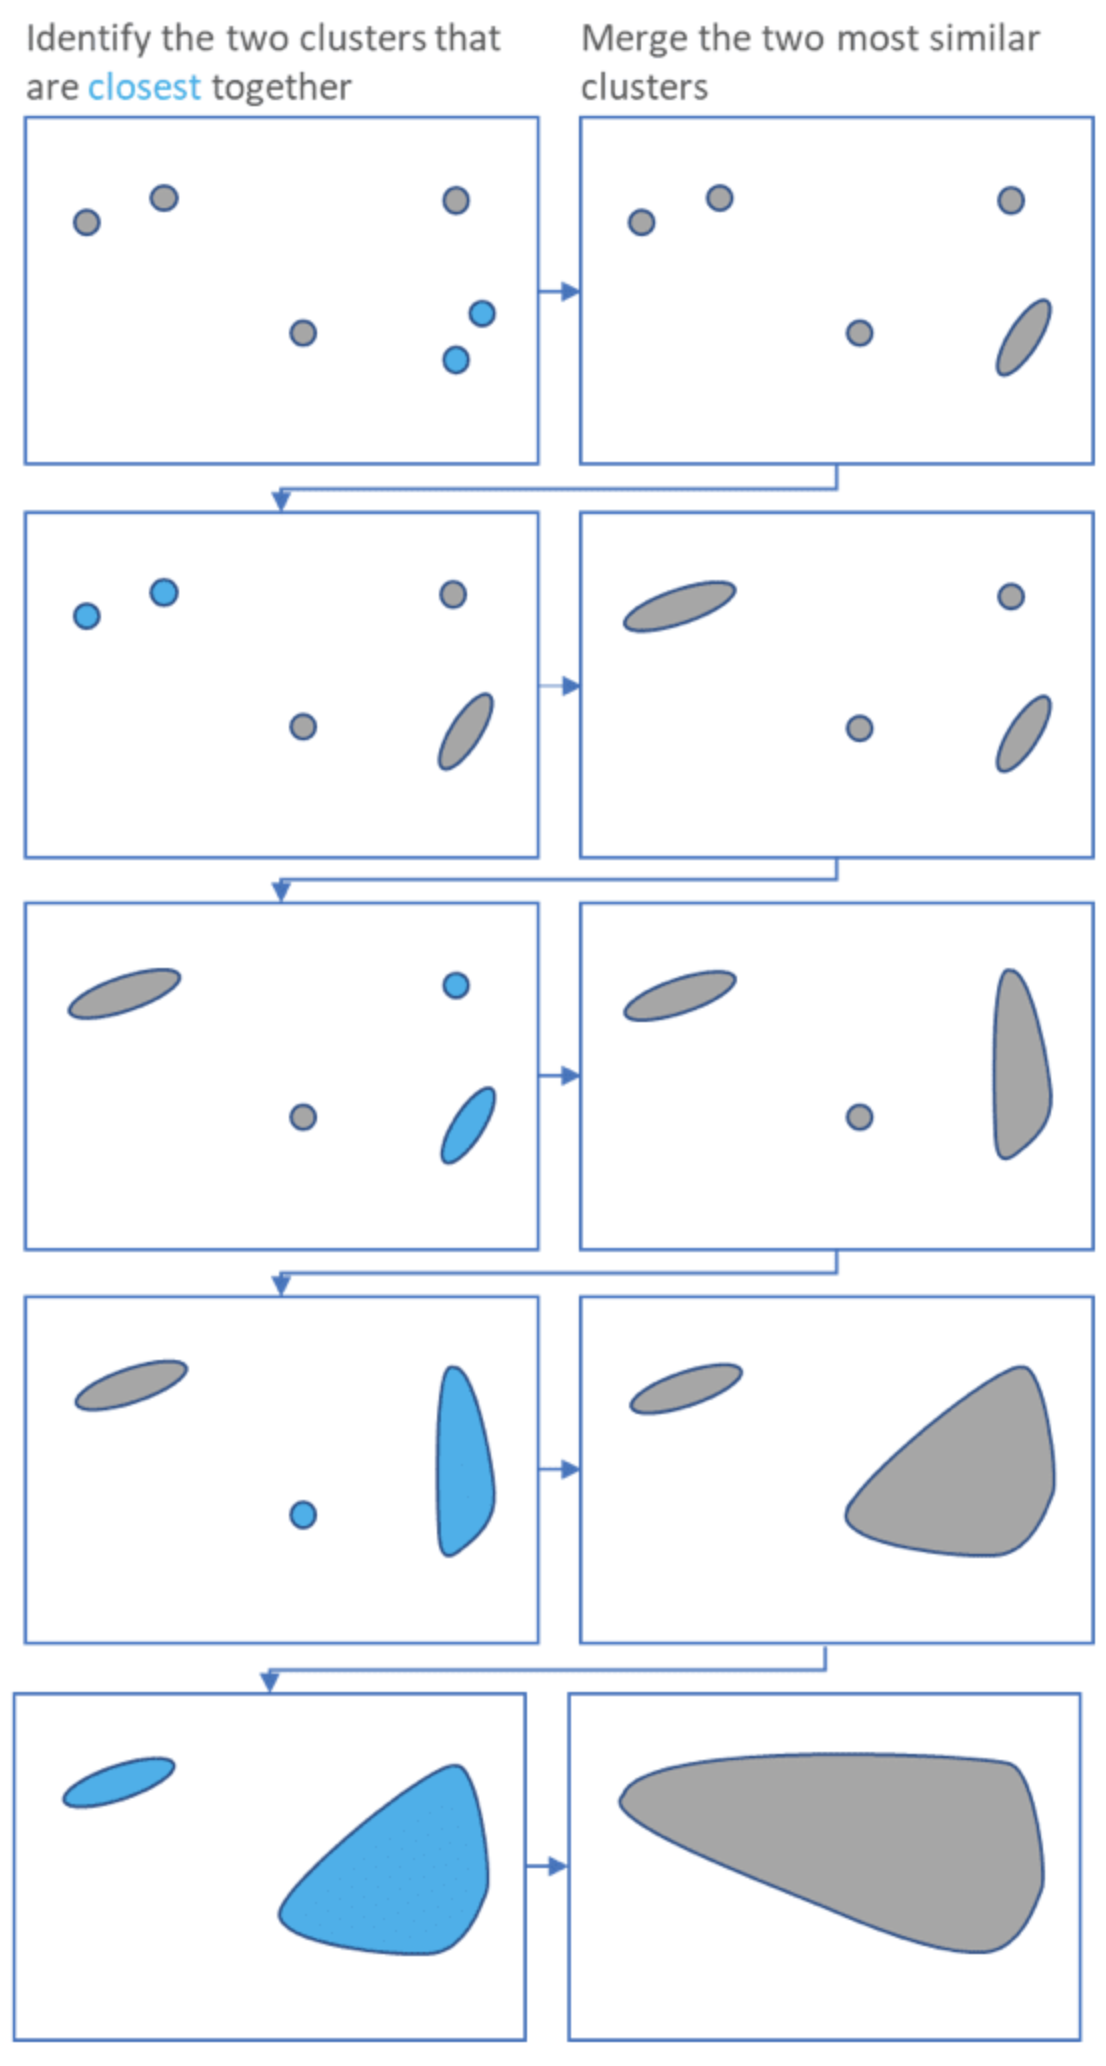
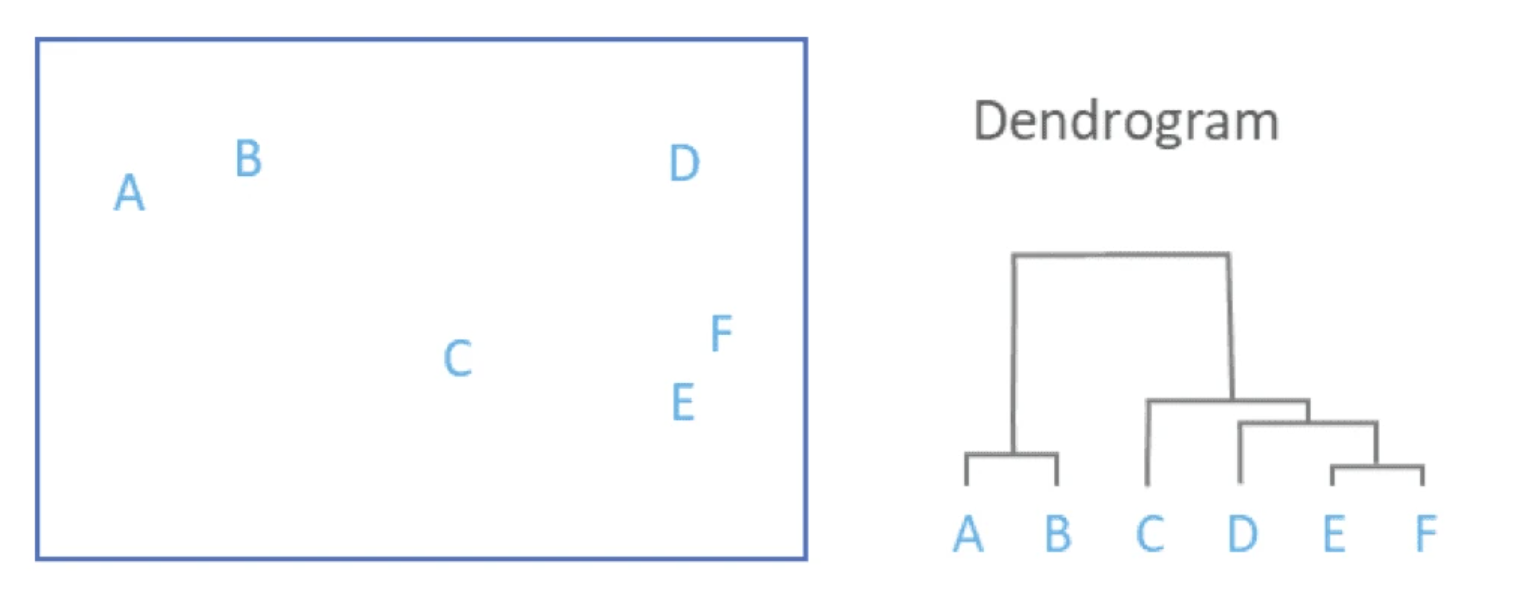
Clustering Examples: Image Segmentation
Goal: Break up the image into meaningful or perceptually similar regions

K-Means Algorithm
An iterative clustering algorithm:
- Initialize: Pick K random points as cluster centers
- Alternate:
- Assign data points to closest cluster center
- Change the cluster center to the average of its assigned points
- Stop when no points assignments change
K-Means Visualization
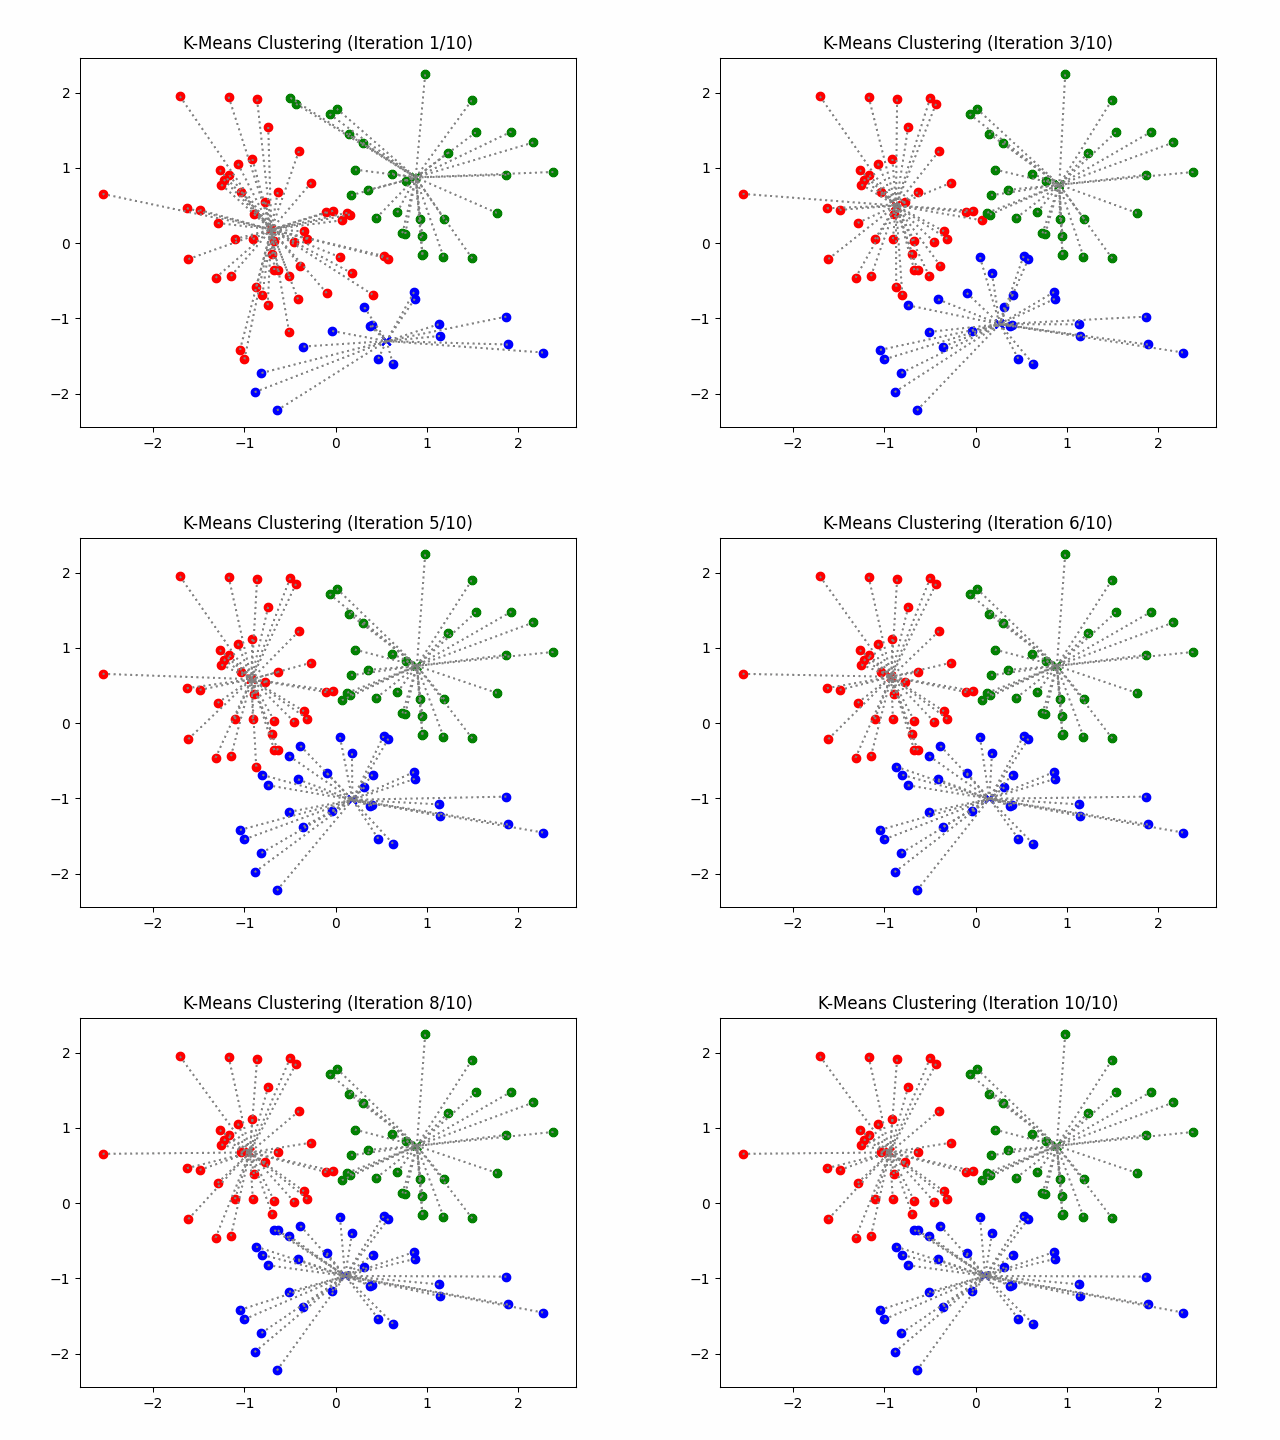
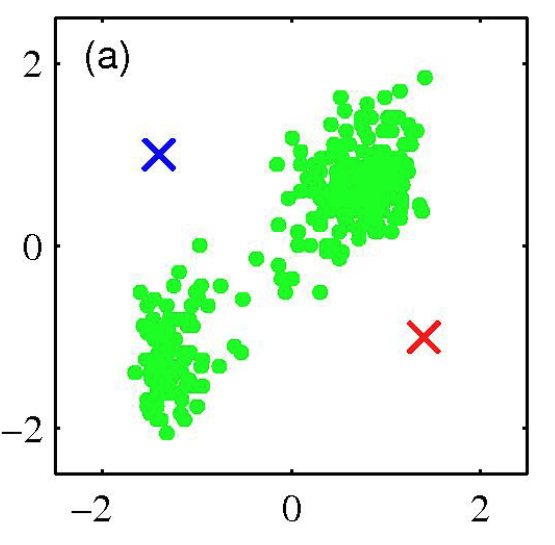
K-Means Example: Step 1
Initial random centers (K=2)
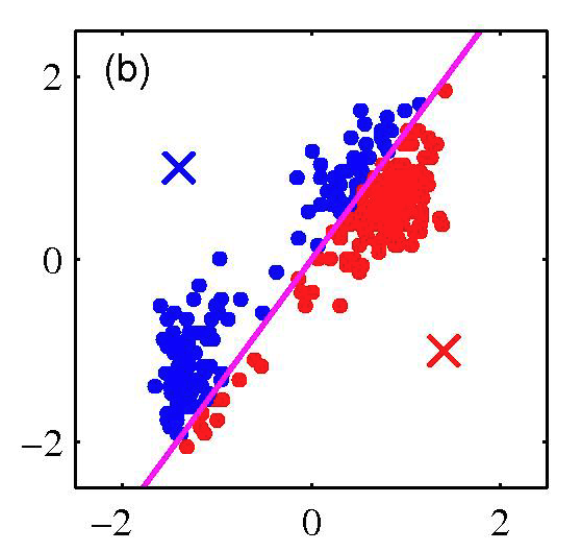
K-Means Example: Step 2
Assign points to nearest center
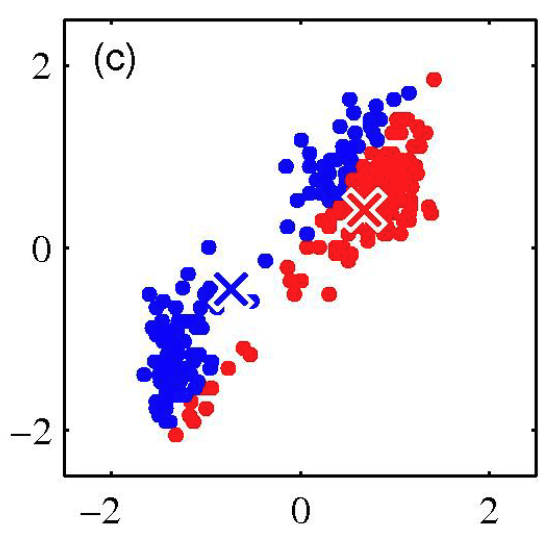
K-Means Example: Step 3
Repeat until convergence
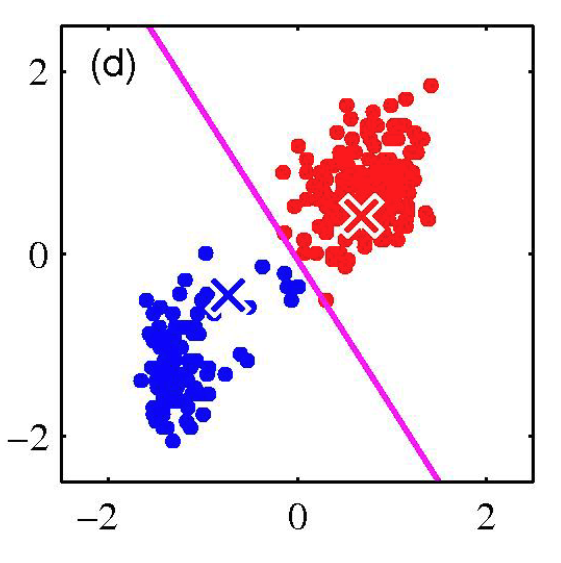
K-Means Example: Step 4
Change the cluster center to the average of the assigned points
Properties of K-means Algorithm
- Guaranteed to converge in a finite number of iterations
- Running time per iteration:
- Assign data points to closest cluster center: O(KN) time
- Change the cluster center to average of assigned points: O(N)
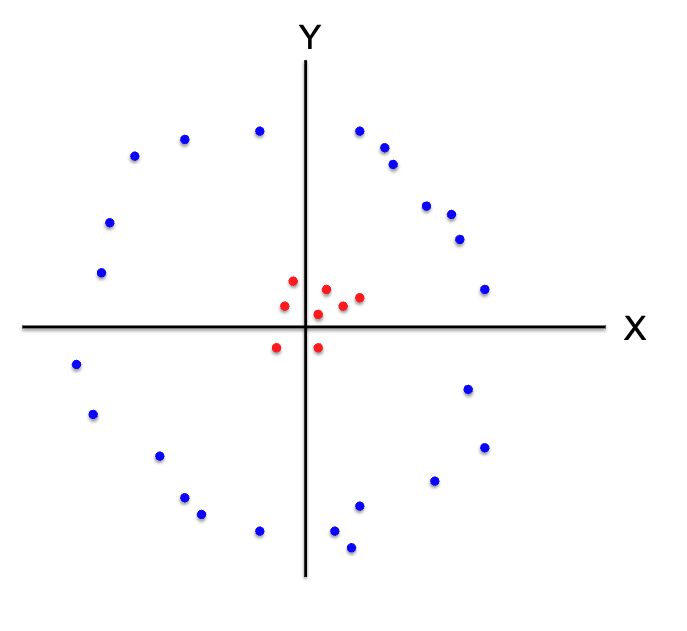
K-Means Getting Stuck
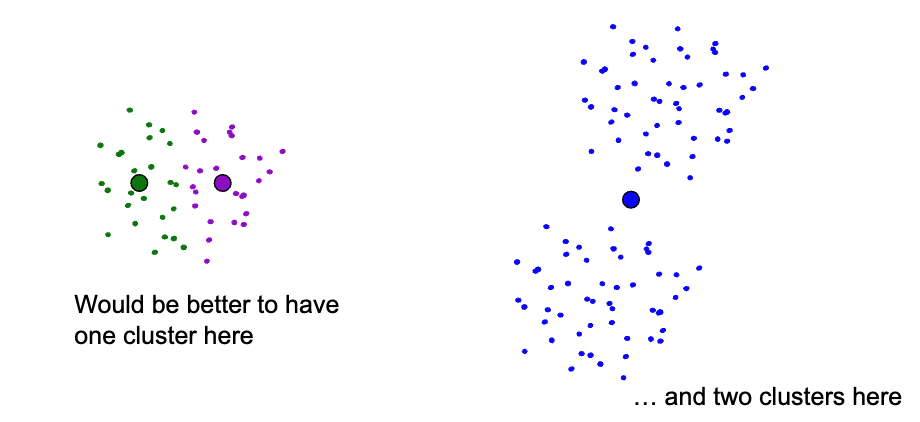
Example of cases where K-Means gets stuck
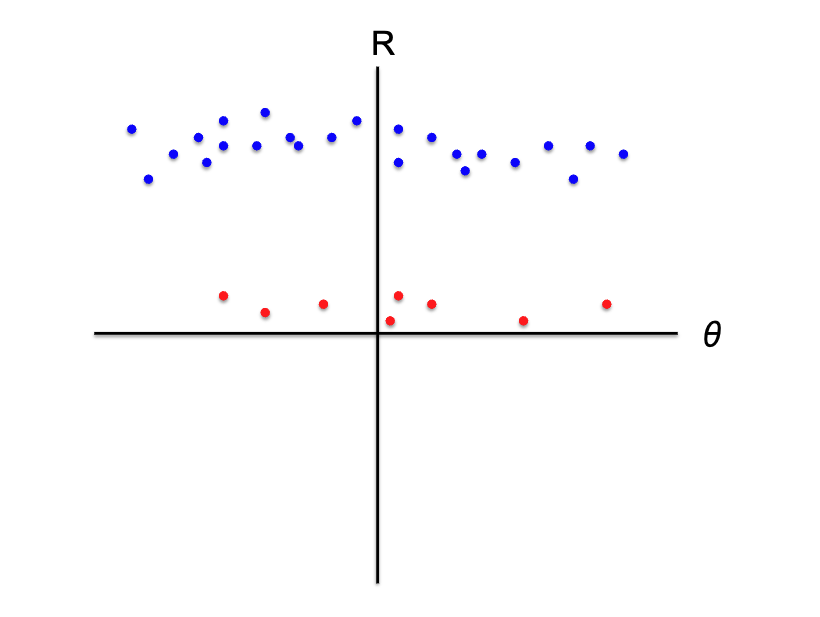
How we can handle such cases
Workshop Part 1: K-Means from Scratch
Let’s implement K-means clustering step by step!
Generate Sample Data
# Generate 3 clusters
cluster1 = np.random.normal(loc=[2, 2], scale=0.5, size=(100, 2))
cluster2 = np.random.normal(loc=[8, 3], scale=0.5, size=(100, 2))
cluster3 = np.random.normal(loc=[5, 7], scale=0.5, size=(100, 2))

# Combine all data
data = np.vstack([cluster1, cluster2, cluster3])

# Number of clusters
k = 3

# Initialize centers randomly
centers = data[np.random.choice(len(data), k, replace=False)]
Function 1: Assign Clusters
def assign_clusters(data, centers):
    """
    Assign each data point to nearest center

    Args:
        data: Array of data points (n_samples, n_features)
        centers: Array of cluster centers (k, n_features)
    Returns:
        Array of cluster assignments for each point
    """
    distances = np.sqrt(((data - centers[:, np.newaxis]) ** 2).sum(axis=2))
    return np.argmin(distances, axis=0)
Function 2: Update Centers
Function 3: K-means Visualization
Part 1
Function 3: K-means Visualization
Part 2
Function 3: K-means Visualization
Part 3
Function 3: K-means Visualization
Part 4
Running K-means
Workshop Part 2: Image Segmentation
Let’s segment an image using K-means
Pre Processing the Image
Setting Stop Conditions for the Algorithm
This line sets the stopping criteria: either 100 iterations or 85% accuracy.
Perform K-Means
Random Centers are initally chosen.
Convert Data into 8-Bit and then into the original image dimension
Final Segmented Image

Thank you
Penn State ACM MLPSU